Making Excel spreadsheets and documents is a boring task which involves full of graphs and charts. But one thing that lacks in them is interaction. For example if you are using spreadsheets in some presentation of yours how many of your viewers actually look at those graphs in detail? If you use CX Now, they probably will!
This tool is not really an add-on in the true sense. When you install it, it shows up under its own interface, from where you can choose the type of chart you want to create—from the different pie charts to the more commonly used bar graphs and loads more. An interesting feature here is the dashboard function, which allows you to see your data represented in the form of analogue dials!
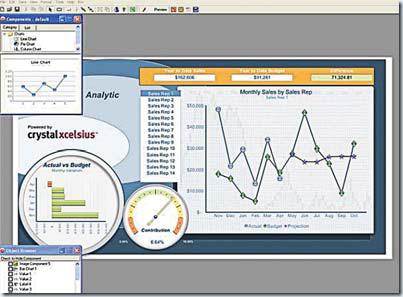
Using CX Now, you can make your charts more interactive by adding sliders to them when you input different values on the X and Y axis, the charts change. All this can be done without having to recreate the chart from scratch.
After the chart is made, you can export it to Excel. Having said that, do bear in mind that this add-on is not for beginners. It takes a fair bit of ingenuity and chart-making experience to get the most out of CX Now, but once you’ve used it, it’s hard to get back to Excel’s inbuilt chart options! Download the free version of CX Now from http://www.businessobjects.com/jump/cxnow/